Use the built-in sampling strategies¤
In this example, we will use the built-in sampling strategies provided by f3dasm to generate samples for a data-driven experiment.
We first create 2D continuous input domain with the make_nd_continuous_domain() helper function:
from f3dasm.design import make_nd_continuous_domain

domain = make_nd_continuous_domain(bounds=[[0.0, 1.0], [0.0, 1.0]])
domain
Domain(input_space={'x0': ContinuousParameter(lower_bound=0.0, upper_bound=1.0, log=False), 'x1': ContinuousParameter(lower_bound=0.0, upper_bound=1.0, log=False)}, output_space={})
Sampling from this domain can be done in two ways:
Method 1: Providing a sampler name as a string¤
Call create_sampler with the sampler's name to get a Block, then invoke its call method on an ExperimentData. Some samplers accept additional parameters, which can be passed as keyword arguments to the factory:
from f3dasm import ExperimentData, create_sampler

# Initialize the sampler
sampler = create_sampler(sampler="latin", seed=42)

# Sample from the domain
samples = ExperimentData(domain=domain)
samples = sampler.call(samples, n_samples=10)

samples
jobs     input
               x0        x1
0  open  0.173199  0.852476
1  open  0.502058  0.215599
2  open  0.460112  0.596991
3  open  0.830424  0.718340
4  open  0.037454  0.386618
5  open  0.718182  0.159866
6  open  0.683244  0.929123
7  open  0.305808  0.095071
8  open  0.215602  0.470807
9  open  0.943195  0.621234
Method 2: Importing the sampler from the f3dasm.design module¤
Another way is to import e.g. the latin() factory from the f3dasm.design module directly and build the sampler block yourself:
from f3dasm.design import latin

sampler = latin(seed=42)
# Sample from the domain
samples = ExperimentData(domain=domain)
samples = sampler.call(samples, n_samples=10)

samples
jobs     input
               x0        x1
0  open  0.173199  0.852476
1  open  0.502058  0.215599
2  open  0.460112  0.596991
3  open  0.830424  0.718340
4  open  0.037454  0.386618
5  open  0.718182  0.159866
6  open  0.683244  0.929123
7  open  0.305808  0.095071
8  open  0.215602  0.470807
9  open  0.943195  0.621234
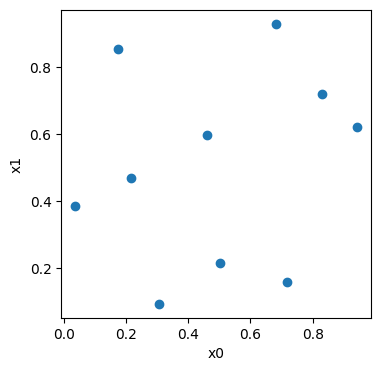
import matplotlib.pyplot as plt

fig, ax = plt.subplots(figsize=(4, 4))

df_random, _ = samples.to_pandas()
ax.scatter(df_random.iloc[:, 0], df_random.iloc[:, 1])
ax.set_xlabel(domain.input_names[0])
ax.set_ylabel(domain.input_names[1])
Text(0, 0.5, 'x1')
Append semantics¤
Sampler blocks append their new samples to the input ExperimentData (via data + new_data) rather than returning a fresh ExperimentData. Calling a sampler twice therefore grows the dataset:
data = create_sampler("random", seed=0).call(data, n_samples=3)
data = create_sampler("latin",  seed=0).call(data, n_samples=4)
# data now has 3 + 4 = 7 rows
Next: Optuna Integration